Category:PD chart
Jump to navigation
Jump to search
Wikimedia category | |||||
| Upload media | |||||
| Instance of | |||||
|---|---|---|---|---|---|
| |||||
See the charts section of Commons:Threshold of originality. See the documentation section of Template:PD-chart. See other PD-ineligible license tags.
Media in category "PD chart"
The following 200 files are in this category, out of 740 total.
(previous page) (next page)-
05 SPSS Faktoriális Anova kontrollcsoportterves eredmény.jpg 609 × 280; 76 KB
-
1-US Household Wealth - Real and Nominal.png 1,042 × 350; 41 KB
-
1954 Industrial zone ratio.svg 2,342 × 1,697; 113 KB
-
1974-2018. Women running for US House and Senate. And results.gif 1,152 × 1,142; 66 KB
-
1Lib1Ref2020.png 627 × 627; 35 KB
-
2 to 10 year treasury spread vs federal funds rate.png 1,168 × 450; 98 KB
-
2 to 10 year yield spread.png 1,461 × 441; 59 KB
-
2014 Fertility Rate of the Islamic Republic of Iran.png 1,168 × 450; 35 KB
-
2023 Linku survey - bend.png 2,007 × 988; 116 KB
-
2023 Linku survey - changes.png 2,007 × 988; 134 KB
-
2023 Linku survey - comparison.png 2,007 × 988; 109 KB
-
2023 Linku survey - cores.png 2,007 × 988; 123 KB
-
2023 Linku survey - obscures.png 2,007 × 988; 152 KB
-
2023 Linku survey - results.png 2,007 × 988; 155 KB
-
2023-12-26 Okertalsperre Füllgrad.png 1,061 × 607; 77 KB
-
2023-12-26 Okertalsperre Wasserabgabe.png 987 × 568; 68 KB
-
2024-12-24 Pegel Altenau I Durchfluss.png 1,184 × 594; 66 KB
-
2024-12-24 Pegel Altenau I Wasserstand.png 1,165 × 597; 89 KB
-
2b2t player count.png 600 × 371; 10 KB
-
2Dsep.png 1,322 × 3,580; 283 KB
-
3d spiral sparse.png 858 × 691; 177 KB
-
5-Bank Asset Concentration in U.S. 1997-2012.png 632 × 381; 29 KB
-
7.62x40 WT.gif 576 × 227; 7 KB
-
A form about heatstroke.png 640 × 228; 78 KB
-
A közlegelők tragédiája.png 970 × 604; 25 KB
-
A tiszaújlaki vallási felekezetek megoszlása.jpg 574 × 386; 47 KB
-
Abduction induction et déduction.jpg 1,616 × 771; 142 KB
-
Adapted narcolepsy relations venn diagram.png 1,407 × 1,125; 183 KB
-
Afghanistan opium poppy cultivation 1994-2020.pdf 900 × 525; 24 KB
-
Age Distribution of Holland MI.png 911 × 623; 64 KB
-
Algorithm for statin-associated myopathy.jpg 810 × 900; 88 KB
-
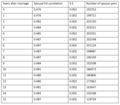
Analysis of Spousal Phenotypic Correlation for Educational Attainment Over Time.png 1,222 × 1,066; 134 KB
-
ANES feeling thermometer 1980 through 2016.jpg 2,158 × 1,662; 290 KB
-
Annual percent change in real GDP 1973-1988.png 1,168 × 620; 28 KB
-
Annual traffic deaths by age Netherlands 1950-2016.png 1,281 × 833; 82 KB
-
Anti-spam by CleanTalk 2.png 1,298 × 876; 67 KB
-
ARMs Indexes 1996-2006.svg 230 × 182; 208 KB
-
Articulation Analogie Abduction 1.jpg 1,074 × 520; 108 KB
-
Articulation Analogie Abduction 2.jpg 1,252 × 546; 131 KB
-
Asymptomatic COVID by age.jpg 2,000 × 1,455; 378 KB
-
Atmospheric terahertz transmittance at Mauna Kea (simulated).svg 850 × 680; 228 KB
-
Azmetab.png 1,152 × 568; 31 KB
-
B2 optimization function.svg 800 × 600; 1.26 MB
-
Bangladesh COVID-19 number of confirmed deaths.png 573 × 329; 17 KB
-
Bar graph - Number of hunters in various countries.svg 1,761 × 1,024; 66 KB
-
BivariateOutlier.svg 756 × 541; 14 KB
-
Blank height chart.jpg 1,024 × 727; 91 KB
-
BlankGraph.png 610 × 610; 118 KB
-
BlueSky user growth.png 1,623 × 836; 236 KB
-
BNT162b2 vaccine efficacy data.png 1,120 × 860; 127 KB
-
Breakeven small.png 324 × 243; 7 KB
-
Brecha-hidrica.gif 510 × 774; 107 KB
-
BrysonModell.jpg 1,272 × 543; 41 KB
-
California vs US Unemployment 1976-2021.png 1,168 × 450; 69 KB
-
Canal-aguas-blancas.png 465 × 288; 34 KB
-
Canal-cuno-en-socaire.png 465 × 288; 35 KB
-
Canal-lauca-sifon-1.png 468 × 290; 37 KB
-
Canal-tilomonte-antes-represa.png 465 × 288; 34 KB
-
Canal-tulan-en-tilomonte.png 465 × 288; 34 KB
-
Canal-vilama-en-vilama.png 465 × 288; 36 KB
-
Capitalization of the Internet.webp 1,315 × 790; 15 KB
-
Caquena-desaguadero-colcacagua.png 1,464 × 604; 142 KB
-
Carnot cycle p-V diagram.svg 1,000 × 800; 14 KB
-
Caudales medios, mínimos y máximos de Quebrada de Jerez.png 962 × 766; 57 KB
-
Caudales-en-camina.png 476 × 322; 23 KB
-
Cfl423-fig1.png 800 × 574; 35 KB
-
Change in household debt - v1.png 1,280 × 720; 111 KB
-
Chart --- Total-US-Consumer-Credit-Outstanding-1945-2011.png 630 × 378; 16 KB
-
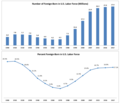
Chart of foreign born in the US labor force 1900 to 2007.png 888 × 761; 35 KB
-
Chinese strokes.gif 510 × 400; 11 KB
-
CHO diagram wendel2015.jpg 1,484 × 1,288; 391 KB
-
Ciclo vida produto.png 586 × 258; 19 KB
-
Circuit pattern.png 213 × 420; 15 KB
-
Citibike daily ridership.png 985 × 525; 110 KB
-
Civilian unemployment rate during Reagan presidency.png 1,168 × 620; 48 KB
-
Clinton econ panel v1.png 1,311 × 738; 203 KB
-
CO2 Emissions from Fossil Fuels - 2018.png 2,000 × 1,195; 914 KB
-
Cole Mining Production US.png 584 × 347; 26 KB
-
Collacagua-coscaya-camiga.png 1,469 × 612; 104 KB
-
Colpitas-lluta-caracarani.png 1,465 × 606; 135 KB
-
Commercial Crude Oil Stock Pile.webp 3,785 × 1,426; 106 KB
-
Commercial Paper Outstanding - Fed Data.png 960 × 720; 189 KB
-
Comparison of 1D and 2D interpolation-ru.svg 737 × 415; 16 KB
-
Consumer Loans 1990 2008.png 417 × 250; 12 KB
-
Conventional expanded left-right spectrum.png 840 × 181; 19 KB
-
Conventional expanded left-right spectrum2.png 1,014 × 169; 28 KB
-
Conventional expanded left-right spectrum3.png 807 × 110; 24 KB
-
Conventional expanded left-right spectrum4.png 994 × 204; 6 KB
-
Corporate profits dollars and pct gdp 1970-2017.png 674 × 347; 41 KB
-
Covid-19 total deaths, and deaths per 100,000 population, by country.png 2,666 × 1,875; 82 KB
-
CPI monthly.webp 4,504 × 1,145; 157 KB
-
CPI vs M2 money supply increases.png 1,168 × 450; 60 KB
-
Crude-oil-price-history-chart-2022.webp 871 × 635; 17 KB
-
CurrencyinCirculation.png 630 × 378; 17 KB
-
Curva de caudales mensuales del río Laco en Cosapilla.png 442 × 278; 32 KB
-
CURVA DE VARIACIÓN ESTACIONAL EN EL RÍO PETORCA EN HIERRO VIEJO.png 537 × 234; 31 KB
-
Cyprus refugee applications.JPG 666 × 328; 61 KB
-
Daily deportations to Treblinka.jpg 1,050 × 566; 112 KB
-
Daily mortality in Spain April 2018–April 2020 by age group.png 1,118 × 1,506; 840 KB
-
Daily mortality in Spain April 2018–April 2020.png 2,216 × 1,091; 177 KB
-
Daily new COVID-19 cases in the UK.png 1,466 × 944; 140 KB
-
Daily new COVID-19 deaths in the UK.png 2,428 × 1,520; 295 KB
-
Data Source World Bank.png 1,467 × 867; 75 KB
-
Death and deportation rates from Theresienstadt by country of origin.png 1,806 × 1,338; 274 KB
-
Dendroexample.png 1,996 × 1,250; 97 KB
-
Diagnostic algorithm of suspected Cushing's syndrome.png 2,213 × 2,627; 190 KB
-
Diagram behaviour anatinae.jpg 1,714 × 2,219; 837 KB
-
Diagram of a security descriptor for a file on Windows.png 916 × 736; 86 KB
-
Diagramm Auswanderung DK - USA.JPG 301 × 275; 28 KB
-
Digital-signal-noise.svg 622 × 376; 2 KB
-
Discontinuity removable.eps.png 2,506 × 1,844; 72 KB
-
Domain Name Registration .tw 2001-2023.png 600 × 450; 3 KB
-
Dominican-Population-1798-1897.jpg 1,024 × 768; 70 KB
-
Double Exponential Function.svg 700 × 550; 19 KB
-
Drug candidates for NAFLD and NASH by mechanism of action as of 2021.jpg 1,200 × 1,049; 79 KB
-
Drug overdose death rates for European countries.png 1,300 × 1,752; 286 KB
-
Déficit commercial (biens) des Etats-Unis.png 518 × 469; 98 KB
-
E-government TELINFO.jpg 2,098 × 2,680; 6.22 MB
-
E. coli OD600 over time.svg 850 × 500; 44 KB
-
E. coli Oxygen partial pressure in various environments.svg 850 × 500; 3.62 MB
-
EAWS Matrix DE 2022.svg 512 × 257; 51 KB
-
Editeurs de WP.png 2,456 × 2,069; 173 KB
-
Editions de WP.png 2,438 × 2,069; 173 KB
-
EdwardsFigure.png 1,696 × 754; 91 KB
-
EEG microsleep.png 2,102 × 330; 40 KB
-
EESA128.png 500 × 535; 11 KB
-
Egészséges Szervezet ábra.jpeg 3,083 × 2,273; 260 KB
-
Ekofisk.png 466 × 350; 15 KB
-
Ekvatorski koordinatni sustav.png 587 × 523; 134 KB
-
Elasticnetreg.png 1,686 × 1,257; 196 KB
-
Electricity prices (day-ahead auction) in Germany in 2021.svg 877 × 620; 1.2 MB
-
Electricity spot prices (day-ahead auction) in Germany in 2022.svg 877 × 620; 2.4 MB
-
Empsit Page 01.png 545 × 430; 13 KB
-
Entwicklung Jahresjagdstrecken Schalenwild Deutschland 1935-2009.png 850 × 826; 135 KB
-
Establishment of Nazi concentration camps timeline.png 2,360 × 1,442; 280 KB
-
Estero-quintero-en-valle-alegre.png 644 × 243; 16 KB
-
Estrutura do Tribunal Supremo de Angola.jpg 2,339 × 1,654; 488 KB
-
Ethnic fractionalization in Australia, Germany, UK and US 1990–2020.png 514 × 532; 102 KB
-
EU-GDP-Population.png 1,000 × 728; 39 KB
-
EU-GDP-Population.svg 800 × 600; 31 KB
-
Eugenol amount and concentration by cigarette type diagram.jpg 616 × 584; 92 KB
-
EUR 5 év.png 512 × 288; 5 KB
-
EUR-RUB exchange rate.webp 3,828 × 839; 63 KB
-
Euro Belarusian Ruble Exchange Rate.webp 4,327 × 979; 121 KB
-
European Court of Human Rights case processing chart.pdf 1,752 × 1,239; 112 KB
-
Excess mortality during coronavirus pandemic, through April 11.png 2,142 × 952; 219 KB
-
Exoterm hidratáció.png 450 × 281; 23 KB
-
Extremely over-expanded jet simulated through CFD.png 712 × 389; 203 KB
-
Ezfst.png 1,569 × 1,409; 191 KB
-
Factoranaly.png 2,093 × 1,409; 124 KB
-
Fahéjalkohol reakciói.png 516 × 432; 6 KB
-
FalconHeritability.png 1,440 × 864; 99 KB
-
Federal Funds Rate and interest rates.png 1,798 × 736; 186 KB
-
Federal funds rate history and recessions.jpg 3,872 × 1,800; 436 KB
-
Federal funds rate history and recessions.png 1,318 × 450; 89 KB
-
Federal Government tax revenue and expenditures.webp 4,411 × 1,045; 76 KB
-
Federal interest payments.jpg 1,974 × 1,194; 173 KB
-
Federal prison year cost.png 1,419 × 473; 51 KB
-
Federal Reserve total assets.png 1,171 × 472; 66 KB
-
FedfundsCAP.png 1,204 × 801; 111 KB
-
Felsőszölnök lakossága 2000 és 2022 között.png 1,317 × 706; 20 KB
-
Female incarceration rates by country and US state.gif 1,195 × 5,257; 147 KB
-
Feynmann Diagram Gluon Radiation.svg 400 × 250; 2 KB
-
Figure 4-1 Trino architecture.png 1,168 × 714; 124 KB
-
Florida vs US Unemployment 1976-2021.png 1,168 × 450; 68 KB
-
FNO ábra 2.png 690 × 256; 9 KB
-
FNO, 1-es ábra.png 809 × 246; 10 KB
-
Fortune-500-ceos-grouped-by-gender.png 1,240 × 840; 91 KB
-
Four Correlations.svg 1,000 × 1,000; 6.73 MB
-
FRED balance sheet 2004-2019.png 968 × 450; 43 KB
-
FRED graph of US labor share 1948–2016.png 969 × 450; 64 KB
-
FRED graph of US labor share 1948–2016.svg 2,138 × 993; 125 KB
-
FRED graph US CPI for All Urban Consumers 1969–2019.png 1,168 × 470; 37 KB
-
FRED-mining-employ.jpg 740 × 383; 34 KB
-
Fukushimar0501.png 600 × 360; 47 KB
-
Fukushimar0503.png 600 × 360; 49 KB
-
FWC26 bid.png 629 × 419; 43 KB
-
Galactic Rotation virgin.svg 250 × 150; 2 KB
-
GalacticRotation2.svg 250 × 150; 14 KB
-
Gdp29-41.jpg 800 × 480; 32 KB
-
GermanImports USSRPerCent.jpg 907 × 650; 133 KB
-
Gibbs (1).jpg 454 × 312; 34 KB
%2C_Pew_Research.png/106px-%22Americans_more_likely_to_saw_growing_diversity_makes_their_country_a_better_place_to_live%22_(2016)%2C_Pew_Research.png)






.svg/120px-Atmospheric_terahertz_transmittance_at_Mauna_Kea_(simulated).svg.png)




_with_mobility.jpg/120px-Boron_PLAD_implant_profile_example_SIMS_and_Differential_Hall_Effect_Metrology_(DHEM)_with_mobility.jpg)




_des_Etats-Unis.png/120px-Déficit_commercial_(biens)_des_Etats-Unis.png)




_in_Germany_in_2021.svg/120px-Electricity_prices_(day-ahead_auction)_in_Germany_in_2021.svg.png)
_in_Germany_in_2022.svg/120px-Electricity_spot_prices_(day-ahead_auction)_in_Germany_in_2022.svg.png)




_sodium_lauryl_sulfate_at_different_temperatures.png/108px-Force_to_cut_as_a_function_of_time_of_hydration_of_beard_hair_in_dilute_(0.5_per_cent)_sodium_lauryl_sulfate_at_different_temperatures.png)


.jpg/120px-Gibbs_(1).jpg)